
RokDoc

Subsurface Data Conditioning

Better Input for Better Output

Assess and Condition Data for Workflow Success

Perform Quality Availability Controls

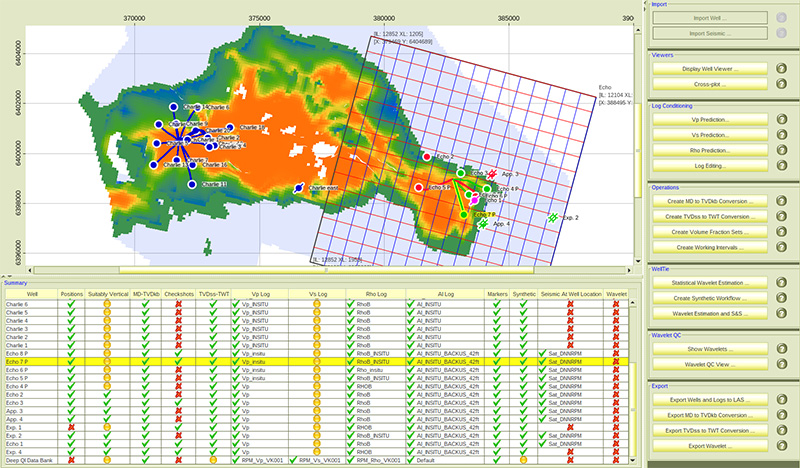
 Are your data loaded, ready, and verified to continue to the next workflow step? Do they lie on trend? Do they agree with physical models? Use RokDoc to prove you have what you need to proceed. 

Well Data Conditioning

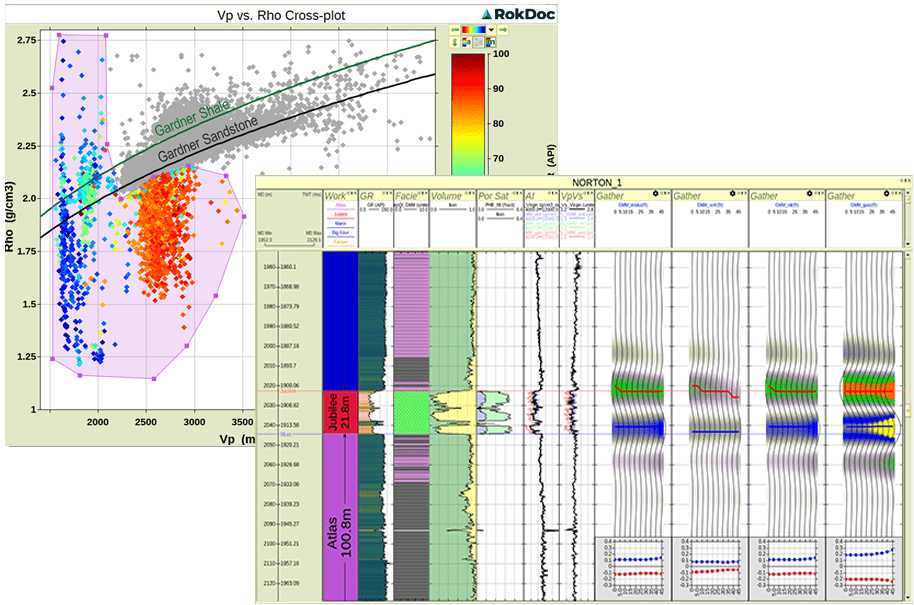
 Acquisition is never perfect. Find and correct log data considering the impact of mud invasion, geometry, anisotropy, and tool resolution inconsistencies using the best rock physics modeling workflows. Compare available datasets with trending tools and render physical models to plan, execute, and verify corrections. 

Seismic Data Conditioning

 Assess quality and accuracy of geometric, spectral, and AVO properties. Even the best processed data often contain residual amplitude issues making them unready for quantitative interpretation. Utilize RokDoc’s seismic data conditioning workflows designed to quantify improvement with the support of rock physics and well log data. 

Why Choose RokDoc for Subsurface Data Conditioning?

Select RokDoc when you want data conditioning embedded in a broader subsurface geoscience workflow that connects directly to rock physics, pore pressure, geomechanics, and uncertainty management. 

How does RokDoc support pore pressure and geomechanics data review?

RokDoc provides a common starting point for cross-disciplinary pore pressure and geomechanics workflows through an integrated data conditioning environment. It enables teams to quickly condition, interpret, and visualize image logs, drilling events, and pressure tests while checking that datasets are consistent with rock physics principles.

Users can also assess data reliability through drilling history and pressure view plots, review regional trends, and identify outliers to further validate data before moving into interpretation and modeling.

What visualization tools are available in RokDoc for data review and correction?

RokDoc provides intuitive, interconnected visualization tools including crossplots, maps, well views, sections, and 3D displays that help users quickly identify, isolate, and correct bad data. These linked views, combined with sophisticated yet user-friendly editing capabilities, make it easier to validate data and maintain workflow efficiency.